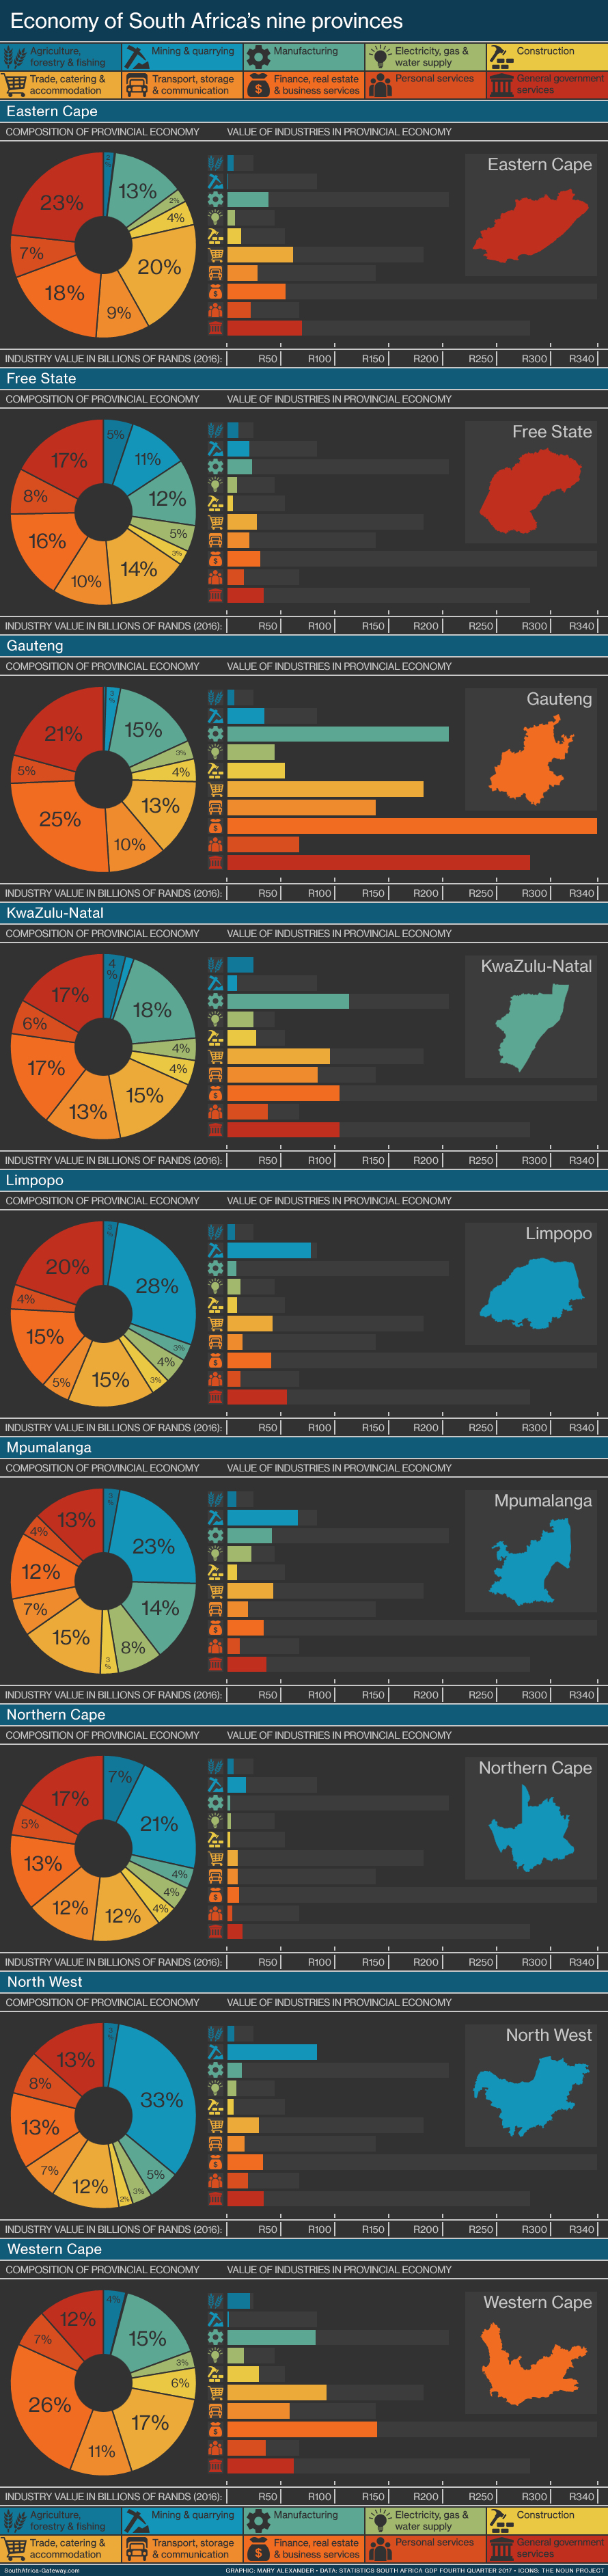
Finance is the biggest industry in Gauteng and the Western Cape. Mining dominates in Limpopo, Mpumalanga, North West and the Northern Cape. KwaZulu-Natal’s major industry is manufacturing. In the Eastern Cape and Free State, it’s government services.

See below for a static version of this animation.
Gauteng contributes more than a third to South Africa’s economy and dominates every sector except mining and agriculture. Mining is the main industry of Limpopo, Mpumalanga, North West and the Northern Cape. KwaZulu-Natal has the country’s largest farming sector, but the province’s major industry is manufacturing – second in size only to manufacturing in Gauteng.
Gauteng’s biggest sector is finance, real estate and business services, which makes up almost a quarter of the province’s economy, followed by general government services, and then manufacturing.
General government services include all major government administrative spending, as well as social grants. Investment in public healthcare and education fall under the category personal services.
Government services make the biggest contribution to the economies of the Free State (followed by finance) and the Eastern Cape (followed by trade, catering and accommodation).
The Western Cape’s largest industry is finance, followed by trade, catering and accommodation (a sector that roughly corresponds to shopping, leisure and tourism).
- READ MORE: The nine provinces of South Africa
In 2016 the main industries in each province were:
- Eastern Cape: government services 21%, trade, catering and accommodation 18%, finance 16%
- Free State: government services 15%, finance 14%, trade, catering and accommodation 13%
- Gauteng: finance 23%, government services 19%, manufacturing 14%
- KwaZulu-Natal: manufacturing 16%, finance 15%, government services 15%
- Limpopo: mining 25%, government services 18%, trade, catering and accommodation 13%
- Mpumalanga: mining 20%, trade, catering and accommodation 13%, manufacturing 13%
- Northern Cape: mining 19%, government services 15%, finance 12%
- North West: mining 30%, government services 12%, finance 12%
- Western Cape: finance 23%, trade, catering and accommodation 15%, manufacturing 14%
See below for the actual figures.
Provincial economies in numbers
Here’s the composition and value of South Africa’s provincial economies in 2016.
All amounts are in millions of rands, so (for example) R7,140 means R7.1-billion, and R1,507,082 means R1.5-trillion.
Eastern Cape economy (in millions)
- Agriculture, forestry and fishing: R5,695 (1.9%)
- Mining and quarrying: R437 (0.1%)
- Manufacturing: R37,724 (12.8%)
- Electricity, gas and water: R7,140 (2.4%)
- Construction: R12,543 (4.2%)
- Trade, catering and accommodation: R60,351 (20.4%)
- Transport, storage and communication: R27,759 (9.4%)
- Finance, real estate and business services: R53,401 (18.1%)
- Personal services: R21,880 (7.4%)
- General government services: R68,820 (23.3%)
- Taxes less subsidies on products: R35,343
- Eastern Cape GDP at market prices (millions): R331,093
Free State economy (in millions)
- Agriculture, forestry and fishing: R10,057 (5.2%)
- Mining and quarrying: R20,501 (10.5%)
- Manufacturing: R22,560 (11.6%)
- Electricity, gas and water: R8,871 (4.6%)
- Construction: R4,990 (2.6%)
- Trade, catering and accommodation: R27,410 (14.1%)
- Transport, storage and communication: R20,203 (10.4%)
- Finance, real estate and business services: R30,551 (15.7%)
- Personal services: R15,511 (8.0%)
- General government services: R33,711 (17.3%)
- Taxes less subsidies on products: R23,485
- Free State GDP at market prices (millions): R217,849
Gauteng economy (in millions)
- Agriculture, forestry and fishing: R6,344 (0.5%)
- Mining and quarrying: R33,927 (2.5%)
- Manufacturing: R204,292 (15.2%)
- Electricity, gas and water: R43,657 (3.2%)
- Construction: R53,278 (4.0%)
- Trade, catering and accommodation: R180,864 (13.5%)
- Transport, storage and communication: R136,434 (10.1%)
- Finance, real estate and business services: R340,571 (25.3%)
- Personal services: R66,177 (4.9%)
- General government services: R278,994 (20.8%)
- Taxes less subsidies on products: R162,545
- Gauteng GDP at market prices (millions): R1,507,082
KwaZulu-Natal economy (in millions)
- Agriculture, forestry and fishing: R23,896 (3.9%)
- Mining and quarrying: R9,226 (1.5%)
- Manufacturing: R112,407 (18.2%)
- Electricity, gas and water: R24,005 (3.9%)
- Construction: R26,836 (4.3%)
- Trade, catering and accommodation: R94,782 (15.3%)
- Transport, storage and communication: R83,412 (13.5%)
- Finance, real estate and business services: R103,667 (16.8%)
- Personal services: R37,262 (6.0%)
- General government services: R103,395 (16.7%)
- Taxes less subsidies on products: R73,334
- KwaZulu-Natal GDP at market prices (millions): R692,222
Limpopo economy (in millions)
- Agriculture, forestry and fishing: R7,051 (2.5%)
- Mining and quarrying: R77,239 (27.8%)
- Manufacturing: R8,124 (2.9%)
- Electricity, gas and water: R12,332 (4.4%)
- Construction: R9,158 (3.3%)
- Trade, catering and accommodation: R41,984 (15.1%)
- Transport, storage and communication: R13,957 (5.0%)
- Finance, real estate and business services: R40,554 (14.6%)
- Personal services: R11,870 (4.3%)
- General government services: R55,104 (19.9%)
- Taxes less subsidies on products: R34,313
- Limpopo GDP at market prices (millions): R311,686
Mpumalanga economy (in millions)
- Agriculture, forestry and fishing: R8,268 (2.9%)
- Mining and quarrying: R64,958 (22.5%)
- Manufacturing: R40,810 (14.2%)
- Electricity, gas and water: R22,522 (7.8%)
- Construction: R9,073 (3.1%)
- Trade, catering and accommodation: R42,455 (14.7%)
- Transport, storage and communication: R19,065 (6.6%)
- Finance, real estate and business services: R33,406 (11.6%)
- Personal services: R11,278 (3.9%)
- General government services: R36,273 (12.6%)
- Taxes less subsidies on products: R35,613
- Mpumalanga GDP at market prices (millions): R323,722
Northern Cape economy (in millions)
- Agriculture, forestry and fishing: R5,937 (7.3%)
- Mining and quarrying: R17,220 (21.2%)
- Manufacturing: R2,927 (3.6%)
- Electricity, gas and water: R3,344 (4.1%)
- Construction: R2,946 (3.6%)
- Trade, catering and accommodation: R9,771 (12.0%)
- Transport, storage and communication: R9,946 (12.2%)
- Finance, real estate and business services: R10,779 (13.3%)
- Personal services: R4,405 (5.4%)
- General government services: R14,001 (17.2%)
- Taxes less subsidies on products: R9,607
- Northern Cape GDP at market prices (millions): R90,883
North West economy (in millions)
- Agriculture, forestry and fishing: R6,637 (2.7%)
- Mining and quarrying: R82,529 (33.3%)
- Manufacturing: R13,401 (5.4%)
- Electricity, gas and water: R8,618 (3.5%)
- Construction: R6,129 (2.5%)
- Trade, catering and accommodation: R29,349 (11.8%)
- Transport, storage and communication: R16,183 (6.5%)
- Finance, real estate and business services: R32,957 (13.3%)
- Personal services: R18,909 (7.6%)
- General government services: R33,267 (13.4%)
- Taxes less subsidies on products: R31,755
- North West GDP at market prices (millions): R279,733
Western Cape economy (in millions)
- Agriculture, forestry and fishing: R20,873 (3.9%)
- Mining and quarrying: R1,268 (0.2%)
- Manufacturing: R81,540 (15.3%)
- Electricity, gas and water: R15,534 (2.9%)
- Construction: R29,416 (5.5%)
- Trade, catering and accommodation: R91,247 (17.1%)
- Transport, storage and communication: R57,544 (10.8%)
- Finance, real estate and business services: R138,179 (25.9%)
- Personal services: R35,555 (6.7%)
- General government services: R61,393 (11.5%)
- Taxes less subsidies on products: R63,495
- Western Cape GDP at market prices (millions): R596,043
Researched, written and designed by Mary Alexander.
Updated 17 June 2021.
Comments? Email mary1alexander@mail.com

The graphics on this page are licensed under a Creative Commons Attribution 4.0 International Licence.
Categories: Infographics, The land
You must be logged in to post a comment.