The South African Multidimensional Poverty Index looks at how poverty reveals itself in people’s health, their level of education, the dwelling they live in, how they cook their food, the water they drink …
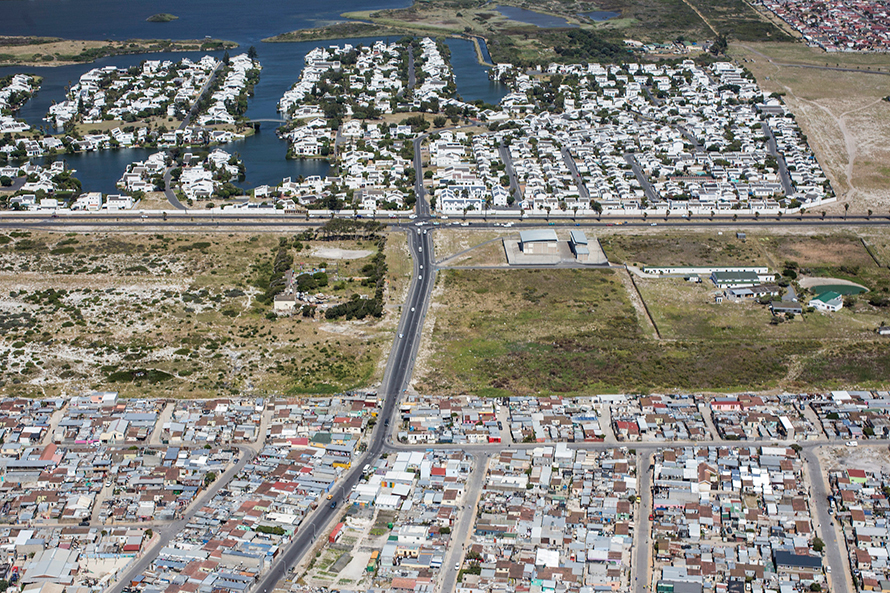
The shacks of Vrygrond township and the walled Marina da Gama housing complex in Muizenberg, Cape Town. South Africa is one of the most unequal countries in the world. (Mikael Colville-Andersen, CC BY 2.0)
Poverty is easy to see, but less easy to define – or to measure across a city, a province or a country. Many measures of poverty use money. If a person lives on less than a certain threshold income they are considered to be living in poverty.
Income is used for the three national poverty lines developed in South Africa. These are the food poverty line (set at R531 per person per month in April 2017), the lower-bound poverty line (R758) and the upper-bound poverty line (R1,138).
Another picture can be painted when we look beyond income to the other ways people experience poverty. How does poverty reveal itself in people’s health, their level of education, the dwelling they live in, how they cook their food, the water they drink? Poverty examined according to different types of deprivation is known as multidimensional poverty.
For its 2016 Community Survey, on which the feature Mapping poverty in South Africa was based, Statistics South Africa used the South African Multidimensional Poverty Index.

Click animation to view from the start.
The index calculates the poverty of households according to four aspects of life: health, education, living standards and economic activity.
These four are known as the dimensions of poverty. Each dimension is assessed according to different indicators.
The poverty indicators
The health dimension has only one indicator: child mortality, or whether a child under the age of five living in the household has died in the past year.
Education has two indicators. One is years of schooling, or whether no person in the household aged 15 or older has completed five years of schooling. The other, school attendance, looks at whether any school-age child seven to 15 years old does not attend school.
Living standards has seven indicators, to do with fuel, water, sanitation, type of dwelling and ownership of assets. What fuel does the household use for lighting, heating and cooking? Is there piped water in the dwelling? Does the household have a flushing toilet? What kind of dwelling does the household live in? What does the household own?
Economic activity is measured by joblessness: whether all the adults, people aged 15 to 64, are out of work.
Each household is scored according to these indicators. If the score is 33.3% or more, the household is living in poverty – they are “multidimensionally poor”.
The South African Multidimensional Poverty Index
| Dimension | Indicator | Deprivation cut-off | Weight |
|---|---|---|---|
| Health | Child mortality | If any child under five in the household has died in the past 12 months. | 25% |
| Education | Years of schooling | If no household member aged 15 or older has completed five years of schooling. | 12.5% |
| School attendance | If any school-aged child (7 to 15 years old) is out of school. | 12.5% | |
| Standard of living | Fuel for lighting | If the household uses paraffin, candles, “other” or nothing for lighting. | 3.6% |
| Fuel for heating | If the household uses paraffin, wood, coal, dung, “other” or nothing as fuel for heating. | 3.6% | |
| Fuel for cooking | If the household uses paraffin, wood, coal, dung, “other” or nothing as fuel for heating. | 3.6% | |
| Water access | If there is no piped water in the household dwelling or on the stand. | 3.6% | |
| Sanitation type | If the household does not have a flushing toilet. | 3.6% | |
| Dwelling type | If the household lives in an shack, a traditional dwelling, a caravan, a tent or other informal housing. | 3.6% | |
| Asset ownership | If household does not own more than one of these: a radio, a television, a telephone or a refrigerator. And does not own a car. | 3.6% | |
| Economic activity | Unemployment | If all the adults (aged 15 to 64) in the household are unemployed. | 25% |
| Total | 100% | ||
The intensity of poverty
The score also measures the intensity of poverty.
In the 2016 Community Survey, the average intensity of the poverty experienced by multidimensionally poor people in the nine provinces ranged from 40.1% in the Western Cape to 44.1% in Gauteng.
Poverty headcount and intensity in South Africa’s provinces
| Province | Poverty headcount | Intensity of poverty |
|---|---|---|
| Gauteng | 4.6% | 44.1% |
| Eastern Cape | 12.7% | 43.3% |
| Mpumalanga | 7.8% | 42.7% |
| KwaZulu-Natal | 7.7% | 42.5% |
| North West | 8.8% | 42.5% |
| Limpopo | 11.5% | 42.3% |
| Northern Cape | 6.6% | 42.0% |
| Free State | 5.5% | 41.7% |
| Western Cape | 2.7% | 40.1% |
 In Gauteng, only 4.6% of the population live in poverty. But the poverty experienced in Gauteng, the wealthiest province, is the most intense.
The multidimensional poverty index is not intended to replace the other important measures of poverty.
The food poverty line, for example, is the rand value below which people are unable to buy enough food to give them the minimum daily energy requirement for adequate health.
The multidimensional index, Statistics South Africa says, should rather be seen as “a complementary measure to these money-metric measures”.
Sources
- Statistics South Africa Community Survey 2016
- Community Survey 2016: Provinces at a Glance
- The South African Multidimensional Poverty Index
- Statistics South Africa: Poverty Trends in South Africa
- World Bank and Statistics South Africa: Overcoming Poverty and Inequality in South Africa
Read more
- Mapping poverty in South Africa
- Infographic: Exploring poverty in South Africa’s provinces
- Map: Distribution of South Africa’s races
- The nine provinces of South Africa
- Infographic: Population density in South Africa’s provinces
- The economies of South Africa’s provinces
- South Africa’s population
Researched, written and designed by Mary Alexander.
Updated 24 June 2019.
Categories: Infographics, People
You must be logged in to post a comment.