Black men have the shortest lives, and white women the longest. Find out more about the country’s population structure with this infographic charting the realities of age, race and sex in South Africa.

Read more: Animation: How long do South Africans live?
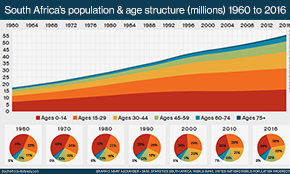
South Africa’s population structure reveals facts of history and continued inequality. Black South Africans are in the majority in every age group. But this majority decreases as the age of the population rises. Coloured, Indian and – especially – white South Africans tend to live longer.
The dent in South Africa’s population pyramid at ages 10 to 24 may be a legacy of South Africa’s Aids epidemic of the 1990s and 2000s.
Read more: South Africa’s population
Researched, written and designed by Mary Alexander.
Updated 10 March 2018.
Comments? Send them to southafrica.gateway@gmail.com
More infographics
 |
 |
 |
 |
 |
 |
Categories: Infographics, People
You must be logged in to post a comment.